

[The CMB Angular Power Spectrum, picture credits NASA/WMAP Science Team]
Above you see the most-often-shown plot in seminars I attended this year. It depicts an analysis of the measured temperature fluctuations the Cosmic Microwave Background (CMB):

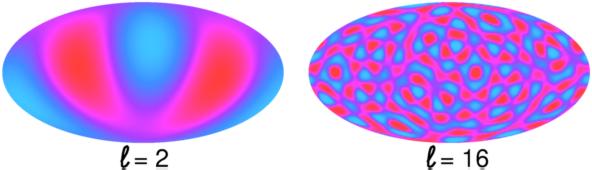
To obtain the CMB power spectrum one roughly speaking decomposes the above shown colorful picture. It contains many structures of various sizes that one takes apart into an overlay of pictures with specific sizes. These are labeled by a parameter l, the multipole moment (see also our earlier post on Anomalous Alignments in the CMB). Below you see as an example l=2 and l=16. Pictorically speaking, l is something like the number of (red) blobs on the equator. Since the equator corresponds to 360°, the size of structures in degrees for a given l is ~ 360°/l.
[Picture from Ned Wright's very recommendable Cosmology Tutorial]
With such a decomposition one gets rid of information like the actual position of blobs, and can analyze the structures of the pattern. In the power spectrum plotted on the x-axis is this multipole moment l, the upper x-axis shows the corresponding scale in degrees. The y-axis (the up-down one) shows the intensity of the temperature fluctuations with the dimension of a squared temperature, micro Kelvin (μK). It is rescaled by a factor l (l+1)/2π (which I think is there to not obscure the intensities with the angular dependent drop in the multipole expansion, please correct me when I am wrong). Note that according to the above the left side of the plot (small l) corresponds to large structures, whereas towards the right, with increasing l, structures become smaller.
If you look at the WMAP picture you would guess that most of the blobs seem to have sizes somewhere around one degree, and indeed you see in the power spectrum the largest peak somewhere around l=200 or so.
Now what is that important for? The matter content of our universe affects the way it expands. The CMB photons can travel freely from the surface of last scattering on. The power spectrum we observe today carries information about what the universe has done since then. For example consider the fraction of dark matter. If one changes it, one obtains a different curve. The amount of dark matter e.g. affects the power of the even to the odd peaks relative to each other:
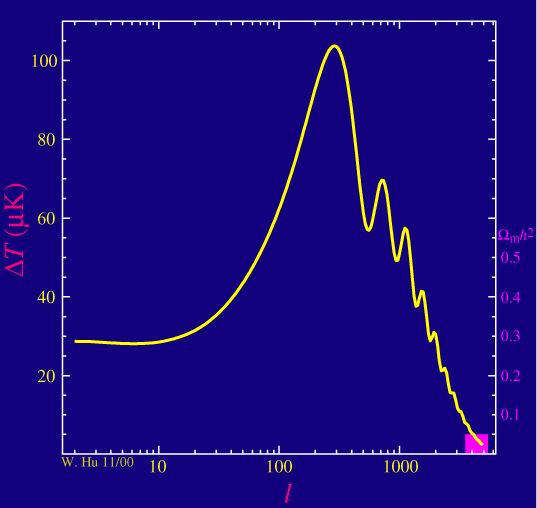
[The pink bar shows the fraction of dark matter. Increasing it lowers the power of the even peaks relative to the odd ones. Picture from this website]
Likewise, changing the cosmological constant would shift the first peak around. In such a way, one can find out which parameters fit best the observed spectrum, which then allows us to draw conclusions about the matter content of our universe.
Did you find my initials in the CMB?
See also: The Power Spectrum of audience attention.
This post is part of our 2007 advent calendar A Plottl A Day.
Hello Bee,
ReplyDeletemost common interpretation of CMB
is Caspar, Melchior and Balthasar,
those levantinian "kings".
Georg
Hi Georg:
ReplyDeleteHah, I didn't know that one :-) Very appropriate for the season. Best,
B.
"To obtain the CMB power spectrum one roughly speaking decomposes the above shown colorful picture. It contains many structures of various sizes that one takes apart into an overlay of pictures with specific sizes."
ReplyDeleteThis brings up a question I've had for a while---why do scientists always present CMB results to the public as a power spectrum rather than a correlation function? As I think you just found out, it's very difficut to explain what a power spectrum measures in clear, non-mathematical terms. The idea of a correlation function, on the other hand, is fairly intuitive. "The correlation function at x degrees is very high, which means that two points x degrees apart on the sky are likely to be the same temperature. On the other hand, the correlation function at y degrees is close to zero, which means that two points y degrees apart are not particularly likely to be the same temperature."
The power spectrum may be more useful (or at least more widely used) in research, but unless you think in Fourier space, it's an intuition nightmare. I can't think of any reason that it should ever be used in public outreach!
unless you think in Fourier space
ReplyDeleteFor the interested laymen and undergraduate students, I recommend this book. If you know nothing or next to nothing about Fourier analysis, you will gain a strong knowledge of the basics that is really helpful. It's a... well, funny book too.
Hi Aaron:
ReplyDeleteoohm, in fact I am very used to thinking in Fourier-space, I find a power spectrum a good thing. Do you have a specific plot in mind? I actually don't know how the CMB features would be easier to find in the correlation function?
Best,
B.
"With the discovery of sound waves in the CMB, we have entered a new era of precision cosmology in which we can begin to talk with certainty about the origin of structure and the content of matter and energy in the universe-Wayne Hu
ReplyDeleteSometimes as a layman not having the "whole lot of knowledge," I thought to put things together that made sense to me.
If string theorists think in terms of "the bulk as Lagrangian," then what would perception have said if we allotted the CMB accordingly as well?
So you adjust the views of Wayne Hu as well to sound?
The view may not have been the right one, yet, it forced one to look at the CMB in new ways.
The Chladni plate was quite useful in this sense.
Whoa... that doesn't look anything at all like the "standard" CDM prediction, even with inflation... ;)
ReplyDeleteBetter get yet *another* box of these babies
... and some antibiotics... errrr.... adiabatics, I mean... *eyeroll*
I like porridge.....:)
ReplyDeleteIMHO, I don't think a correlation function is easy to explain either. Once you understand what a correlation function is, it's an intuitive concept, but there is quite a learning curve.
ReplyDeleteI'm not sure about the l(l+1)/(2\pi) thing... AFAIK the multipole expansion comes with coefficients of (4\pi)/(2l+1), with or without a square root depending on whether you're looking at a product of two. Any ideas?
By experiment I have found that the same entropy-dissipation law is behind sound energy as behind electrodynamic energy.
ReplyDeleteThis is why wave-energy is displaced towards equilibrium.
But it is as Leo Tolstoys said:
"I know that most men, including those at ease with problems of the greatest complexity, can seldom accept even the simplest and most obvious truth, if it be such as would obliged them to admit the falsity of conclusions which they have delighted in explaining to colleagues, which they have proudly taught to others, and which they have woven, thread by thread, into the fabric of their lives."
Bee --
ReplyDeleteI'm thinking specifically of the baryon acoustic peak in the correlation function, which (if I understand it correctly) shows up as a series of peaks in the power spectrum. It's very easy for me to visualize how a point overdensity in the early universe would send out a shock wave, leading to a spherical overdensity correlated with the (now-rebounded) initial overdensity. And sure enough, you can see the frozen shock wave right there in the correlation function!
To sum it up, the reason I prefer to think in real space when I'm thinking about cosmology is the same reason that I prefer to think in Fourier space when I'm thinking about sound. Important things in the universe, like shock waves, appear as coherent objects in real space, while important things in music, like pure tones, appear as coherent objects in Fourier space.
p.s. Everything I know about the acoustic peak I learned from David Eisenstein's excellent home page, which unfortunately seems to be offline right now.
Lex --
ReplyDeleteYou may have a point there. The correlation function learning curve is certainly far behind me, and I may not be remembering how hard it was to learn at first. Still, I think the correlation function is much easier to explain to laypeople than the power spectrum, and I do remember that when I was younger, the "explanations" of power spectra given in newspaper articles and popular science books always completely mystified me.
As a lay person with regards to the complexity of the language(sound)and universe, it is sometimes reduced to "seeing in ways that are much easier to deal with," although of course, it may not be the same for everyone?:)
ReplyDelete:)Something good science people "do not want to hear?"
Good link in html.
The launching of the sound waves is very similar to dropping a rock in a pond and seeing the circular wave come off (obviously that a gravity wave, not a compressional wave, but I’m focusing on the geometry). The difference here is that the area where the “rock” entered is still the most likely region to form galaxies; the spherical shell that it produced is only carrying 5% of the mass.
Hopefully, this demystifies the effect: we’re seeing the imprint of spherical sound waves launched
from the sites of dark matter overdensities in the early universe. But also I hope it makes it more clear as to why this effect is so robust: the propagation of sound in the baryon-photon plasma is very simple, and all we’re doing is measuring how far it got.
"Mapping," had to begin somewhere. Whatever that may mean,one may think of Mendeleeev or Newlands.
Generally Grouping Order increases the density of objects within a frame of reference, resulting in a more pronounced single object.
Sand with pebbles on a beach? It had to arise from someplace?
The other side of the Coin is?
This recording was produced by converting into audible sounds some of the radar echoes received by Huygens during the last few kilometres of its descent onto Titan. As the probe approaches the ground, both the pitch and intensity increase. Scientists will use intensity of the echoes to speculate about the nature of the surface.
and not to be undone.
Mass results in an increase in the gravitational force exerted by an object. Density fluctuations on the surface of the Earth and in the underlying mantle are thus reflected invariations in the gravity field.As the twin GRACE satellites orbit the Earth together, these gravity field variations cause infinitesimal changes in the distance between the two. These changes will be measured with unprecedented accuracy by the instruments aboard GRACE leading to a more precise rendering of the gravitational field than has ever been possible to date.
Layman pondering.
Plato --
ReplyDeleteThanks for finding Daniel Eisenstein's acoustic peak tutorial in the cache! I am very embarassed to discover that I got his first name wrong...
Hi,
ReplyDeleteYou may be interested in my own Analysis of the WMAP data analysis, which suggests that the observed features are actually due to incorrect assumptions in the data analysis and have nothing to do with the cosmic microwave background.
Thomas
to bad though the observed features are in best agreement with our theories. would you please omit distributing links to your site, I neither have the time nor the patience to repeat what you find written in hundreds of publications. otherwise I will have to delete your comments. thanks,
ReplyDeleteB.
Hi Bee,
ReplyDeleteSorry if you got the impression that I was spamming your blog. This is not at all the case. I merely wanted to make the point here that some features in the CMB power spectrum could actually be artifacts of the data analysis, and I linked to my own website only for the same reason as you are linking to other sites, namely to provide more information for the interested reader (that I could not very well give on your blog).
In this sense, I don't actually quite understand your counter-argument: why would you still come to the conclusion that the data agree with your theory if the data analysis is flawed?
Thomas
Hi Thomas,
ReplyDeleteI'd agree that there could be features in the CMB data that are artifacts of the data analysis, esp. in the small l area. But just saying 'the observed features' are results of incorrect data analyis doesn't explain anything. There's data, there's analyisis, and the result is explained very well with our theories. If you suggest another analysis then you'll need another explanation. I didn't read your website since I am pretty much sick and tired of repeating endlessly the most elementary things to people who claim all CMB measurements are pigeonshit on the Hubble telescope, I paraphrase, but this is the essence. I hope you are aware that there are several other data sets besides WMAP that have measured the first acoustic peak, I assume the pigeonshit is universal on all telescopes. As I said above, I do find it possible that there are still glitches in the data analysis, but just saying 'the observed features' have nothing to do with the CMB I find highly unlikely.
And yes, I regard your comments as spam if you leave links to your own site. Your reply stating 'this is not the case' doesn't change my mind, but thanks for your polite answer. Best,
B.
Hi Bee,
ReplyDeleteThanks for your reply.
I am actually particularly referring to the power spectrum at high l-values, corresponding to angular scales approaching the resolution limit of the WMAP telescopes (0.3 deg and less). In this range, there are only very poor and inconclusive data by other experiments.
And no, I don't assume pigeons are responsible for the observed feature in this range (the 'second acoustic peak'), but it should be the differential twin- design of the telescope. The point is that for a homogeneous background noise (which is more or less the case for the CMB radiation), the difference between the count rates will not be zero but, according to the laws of statistics, on average be equal to the square root of the count rates (the standard deviation). In this situation, the beam profile for the differential signal is consequently not identical to the profile of the single beam but given by the square root of the latter (e.g. a beam profile function exp(-x^2) would transform into exp(-0.5*x^2) and the resolution be correspondingly reduced). The original WMAP analysis has not taken into account this statistical effect, but assumed the effective beam profile for the differential system to be identical with the individual beam profile. This neglection leads to an apparent peak at about 0.2-0.3 deg (as shown on my web page). And the observed amplitude of the peak is also consistent with the interpretation as a systematic statistical error in this sense.
This conclusion was actually confirmed last year when the year-3 WMAP data were published: the difference between the 3- and 1-year maps shows residuals that have about the same amplitude as the 'second acoustic peak'.
Thomas
Hi Thomas,
ReplyDeletewell, that sounds more interesting. Gee, if you leave a comment saying the observed features are crap and I've done everything better, this sounds pretty much like the emails I usually get saying I've proven Einstein wrong, and besides I have a completely new quantum mechanics. Comes usually with lots of capitals and exclamation marks.
Yes, the data in the high l regime has large error bars and needs to be checked with other experiments. I think there's something planned but I keep mixing up the names of these experiments, maybe you know better? The twin telescope setup has been blamed apparently for a lot of features, but this is a new one for me. I don't quite get the argument though. For one, I don't know what 'x' is. But besides this, shouldn't the error in the statistical deviations drop with more counts. Are you arguing there is a correlation between the detectors? Best,
B.
Bee, any opinions on the "axis of evil"?
ReplyDeleteHi Neil': Please see here.
ReplyDeleteany opinions on the "axis of evil"?
ReplyDeleteNorth Korea should be removed from the list.
I like porridge.....:)
Crank, crackpot, creationist, etc... and other stereotypically lame remarks that I can make before censoring you without actually ever justifying a single remark or action.
Get used to it.
Bee said:
ReplyDeleteI don't quite get the argument though. For one, I don't know what 'x' is. But besides this, shouldn't the error in the statistical deviations drop with more counts. ?
x in exp(-x^2) is the angular distance from the center of the beam profile of the telescope (the latter being assumed as Gaussian here). The sensitivity of the telescope (i.e. the count rate) is therefore a function of x. If let's say the count rate within an interval dx at x=0 is 100, then at x=1 it is 100/e. Now assume that you have two telescopes that look at two radiation fields which have an identical average intensity but are of a completely random (uncorrelated) nature (the radiation fields are uncorrelated because the telescopes look into completely different directions), then subtracting the count rates from another will not yield 0, but a statistical residual with an absolute value of sqrt(2)*sqrt(100) in the beam center (x=0), and sqrt(2)*sqrt(100/e) at x=1. So whereas for the individual telescope the count rate decreases by a factor 1/e from x=0 to x=1, it decreases only by a factor 1/sqrt(e) for the 'differential telescope'. Generally, speaking any individual beam profile p(x) results therefore in a differential beam profile sqrt(p(x)) under these conditions. This has not been taken into account in the WMAP data analysis.
Thomas
Hi Thomas:
ReplyDeleteSorry, I still don't understand it. You are talking about the statistical error in the measurements. You have that error for a single telescope, and you have it for the twin telescopes as well. The error goes down with 1/ square root of the measurements. Less measurements, larger error. Obviously, if there's little data, there will be statistical deviations that can spoil the potential signal if one wants to measure the deviations from the average like here. I fail to see though why this gets worse with the twin telescopes. You start with a scenario in which the count rate decreases with 1/e. Then the error goes with 1/sqrt(e). Or I don't understand what you mean with count rate. I would have though the number of measurements (photons) per time? But that can't quite be because you've assumed it drops by 1/e, then it does so and not otherwise as you conclude later. It would really help if you'd just explain what you are talking about, because I am not in the mood the to guess around. Also, I am a particle physicists, and I don't know what you mean with 'beam' - I guess it's not what I understand under 'beam'. I've read through your website, looked up the references you mentioned, the NASA websites and a couple of other sites, but then my patience was exhausted. Best,
B.
Hi Bee,
ReplyDeleteThe statistical error I am referring to here is a fixed quantity as it is merely related to the number of CMB photons registered within the integration time of the radiometer (which is set to about 0.1 sec).
I have done the explicit calculation right at the bottom of my web page: the number of CMB photons registered during the integration time is 3*10^9, the relative statistical error associated with this is 1/sqrt(3*10^9) = 1.8*10^-5. This is practically the same ratio as that of the amplitude of the 'second acoustic peak' to the average CMB temperature (50 microK/2.7K).
The only thing that changes by repeating this measurement a greater number of times is that the feature becomes better defined, but it doesn't change its amplitude (you can see this when you compare the 3-year- with the 1-year power spectrum).
Thomas