
 |
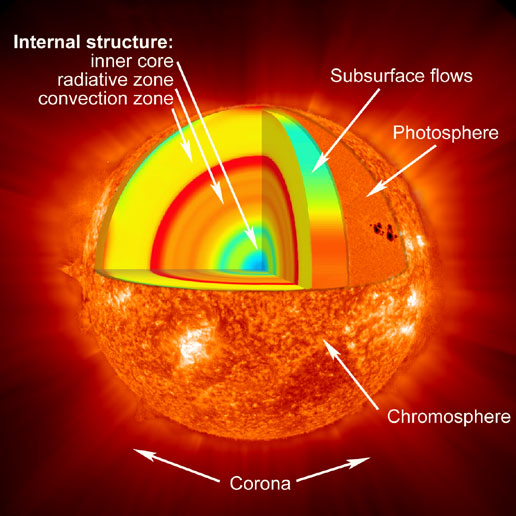
| The layered structure of the sun. Click to enlarge. Image credits: NASA |
The Sun spins about a fixed axis, but since it's not solid its rotation frequency is not uniform: At the visible surface, the equator rotates in about 27 days whereas close by the poles it takes 35 days. The plasma that forms the Sun is held together by its own gravitational pull with a density that is highest in the center. In this high density core, the sun creates energy by nuclear fusion. Around that core, there's a layer, the radiative zone, where the density is already too small for fusion, and the heat created in the core is just passed on outwards by radiative transfer. Further outside, when the density is even lower, the plasma then passes on the heat by convection, basically cycles of hot plasma moving upwards and cooler plasma moving downwards. Even further outside, there's the photosphere and the corona.
The physics of the convection zone is difficult because the motion of the plasma is turbulent, so it's hard to understand analytically and numerical simulations require enormous computing power. Some generic features are well understood. For example the granularity of the sun's surface comes about by a mechanism similar to Rayleigh–Bénard convection: In the middle of the convection cell there's the hot plasma rising and towards the outside of the cell there's the cooler plasma moving down again.
It also has been known since more than a century that sunspots are not only colder than the normal surface of the sun, but are also regions with strong magnetic fields. They arise in pairs with opposite magnetic polarity. Sunspot activity follows a cycle of roughly 11 years, after which polarity switches. So the magnetic cycle is actually 22 years, on the average.
A big puzzle that has remained is why sunspots are created predominatly in low latitudes (below 30°N/above 30 S) and, over the course of the solar cycle, their production region moves towards the equator. When one plots the latitude of the sunpots over time, this creates what is known as the "Butterfly diagram", shown below
You can find a monthly update of the butterfly diagram on the NASA website. The diagram for the magnetic field strength follows the same pattern, except for the mentioned switch in polarity, see for example page 54 of this presentation. On the slide, note that in the higher latitudes the magnetic fields move towards the poles rather than towards the equator.
Numerical simulation of the convection zone have been made beginning already in the early 80s, but so far something always left the scientists wanting. Either the sunspots didn't move how they should or the rotation wasn't faster towards the equator, or the necessary strong and large-scale magnetic fields were not present, or something else just didn't come out right.
At Nordita in Stockholm, there's a very active research group around Axel Brandenburg, which has developed a computer code to simulate the physics of the convection zone. It's called the "pencil code" and is now hosted by Google code, for more information see here. Basically, it's an integration of the (non-linear) hydrodynamics equations that govern the plama with magnetic fields added. In the video below you see the result of a very recent simulation done with his collaborators in Helsinki:
The colors show the strength of the magnetic field (toroidal component), with white and blue being the strongest fields, blue for one polarity and white for the other. Two things you should be able to see in the video: First, the rotation is faster at the equator than at the poles, second, the spots of strong magnetic fields in low latitudes migrate towards the equator. One can't see it very well in the video, but in the higher latitudes the magnetic fields do move towards the poles, as they should. In the time-units shown in the top-left corner, about 600 time steps correspond to one solar cycle. A computation like this, Axel tells me, takes several weeks, run on 512 to 2048 cores.
Details on how the movie was made can be found in this paper
- Cyclic magnetic activity due to turbulent convection in spherical wedge geometry
Petri J. Käpylä, Maarit J. Mantere, Axel Brandenburg
arxiv: 1205.4719
The calculation doesn't actually simulate the whole convection zone, but only a wedge of it with periodic boundary conditions. In the video this wedge is just repeated. The poles are missing because there the coordinate system becomes pathological. In the part that they simulate, they use 128 x 256 x 128 points. A big assumption that goes on here is that the small scales, scales too small to be captured at this resolution, don't matter for the essential dynamics.
If you found the video was too messy, you can see the trend of the magnetic fields nicely in the figure below, which shows the average strength of the magnetic fields by latitude as a function of time.
 |
| Fig 3 from arxiv:1205.4719. |
Not all is sunny of course. For example, if you gauge the timescale with the turnover time in the convection zone which can be inferred from other observatons, the length of the magnetic solar cycle is about 33 years instead of 22. And while the reason for the faster rotation towards the equator can be understood from the anisotropy of the turbulence (with longitudinal velocity fluctuations dominating over latitudinal ones), the butterfly trend is not (yet) analytically well understood. Be that as it may, I for certain am impressed how much we have been able to learn about the solar cycle despite the complicated turbulent behavior in the convection zone.
The original movie (in somewhat better resolution) and additional material can be found on Petri's website. Kudos to Axel and Amara for keeping me up to date on solar physics.
Even before I read the list of authors, I knew that Axel Brandenburg was on it. Axel also holds the prize for the greatest praise in an erratum by someone else.
ReplyDeleteInteresting! But if all these models are correct why does recent Radar Doppler Velocimetry shows the convection currents to be 100 times slower?!
ReplyDeletehttp://arxiv.org/abs/1206.3173
If looked at from a different perspective this is just the Sun's attribution and characteristic displayed in Helioseismology.
ReplyDeleteBest,
I think Amara would find this of great interest combined with her research from her comments in past posts....maybe?
ReplyDeleteBest,
Hi Bee,
ReplyDeleteThanks for the nice synopsis of the current extent of knowledge in relation to our sun and therein star dynamics more generally. I was brought to thinking about such a short time ago with reading some material about how it’s still not well understood as to how the photosphere of the sun can have a temperature of only 6000K, while the coronas area above (atmosphere) averages between 1,000,000 -2,000,000K, with having some regions reaching temperatures as high as 20,000,000K. It would be interesting to learn if any of the research you've presented here sheds some light upon this still outstanding problem.
Best,
Phil
Hi Phil,
ReplyDeleteYes, that's another one of these puzzles. I believe there's been some progress on that, it's also got something to do with the magnetic fields, but then I don't know the details. Maybe stuff that will make another blogpost some time. Best,
B.
@Raptis: You are absolutely right of course. The paper you point out is very interesting. Actually there is one point missing in the description in this blog about the simulations. In all such simulations the coriolis number, which is the ratio of angular velocity of the sun and the rms value of the fluctuations is taken to be about 10. Whereas all such estimates in the sun shows that to be about unity. The simulations does not even show a dynamo for coriolis number order unity. The paper you point out actually shows that the coriolis number of the sun may have been wrongly estimated so far, and it is close to 10 than one. If this result is indeed correct, then the simulations reported in this blog are closer to reality that we had thought. That is actually a great triumph for numerical simulations.
ReplyDelete@ Phil : The clue to the puzzle mentioned by you have been speculated to be due to heating of the corona by magnetic reconnection (possibly first pointed out by Parker). The idea is the at the corona magnetic diffusivity is too low, but not zero. Then gives rise to very strong gradients in magnetic field which then dissipate by local events. These events, also called reconnections, generated very high local temperature. The temperature in the corona is thus very high but also very intermittent. As with so many problems in astrophysics, this is not "proven". This is rather a conjecture which at present is thought to be true.
IMO the motion of solar plasma is driven with Corriolis force. It's rotating around center of mass of solar system, affected mostly with position of Jupiter planet.
ReplyDelete